 Cup & Ratio
Extraction Physics & Yield Math
Coffee refractometer calibration and sampling
A precise display cannot compensate for an unrepresentative sample.
Before you start
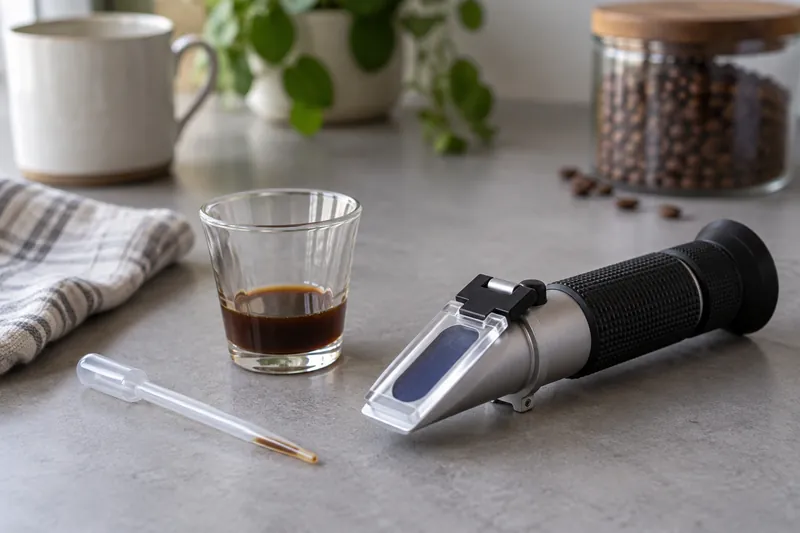
A precise display cannot compensate for an unrepresentative sample. Follow the instrument maker’s calibration and sample preparation guidance. Stir the beverage before taking a sample, and be especially careful with suspended fines and espresso crema, which can interfere with consistent readings.
Every extraction calculation in modern specialty coffee—including every formula in our Coffee Extraction Yield (EY%), TDS & Brew Ratio Compass—depends on a single analytical instrument: the refractometer. Yet two baristas measuring the exact same cup of V60 pour-over on two digital refractometers frequently report TDS numbers that differ by 0.08% to 0.25% TDS, translating to an apparent extraction yield disagreement of 1.3 to 4.0 percentage points (EY%)!
To eliminate refractometer measurement error—and to understand how an affordable digital Brix refractometer can be converted into a precision coffee TDS meter—we must examine Snell’s Law of Refraction, the sucrose-to-coffee refractive index polynomial (0.85 × Brix), thermal equilibrium drift (dn/dT), and colloidal light scattering.
1. How a Coffee Refractometer Actually Works: Snell’s Law and Critical Angle
When light travels from a dense optical prism (refractive index n_prism ≈ 1.72) into a thin liquid coffee sample sitting on top of the prism (refractive index n_sample ≈ 1.335), the light rays bend according to Snell’s Law:
n_prism sinθ_1 = n_sample sinθ_2At a specific incident angle known as the critical angle (θ_c), the refracted angle θ_2 reaches 90° (sinθ_2 = 1), and all light at steeper angles undergoes total internal reflection back onto a linear CCD/CMOS sensor array inside the instrument:
θ_c = arcsin(\frac{n_sample}{n_prism})At 20.0°C under sodium D-line illumination (λ = 589.3 nm), pure distilled water (0.00% TDS) has a refractive index of exactly n_D^20 = 1.33299. As organic acids, caffeine, carbohydrates, and melanoidins dissolve into the brew water, the optical density of the liquid increases linearly with solute concentration, shifting the shadow boundary on the CCD sensor by roughly Δ n_D ≈ +0.000178 per 0.10% TDS.
2. Converting Brix (°Bx) to Coffee TDS%: The 0.85 Factor
Most general-purpose food and beverage refractometers (used in winemaking, brewing, and fruit harvesting) report measurements in degrees Brix (°Bx), where 1.00°Bx is defined as 1.00 g of pure sucrose (C_12H_22O_11) per 100 g of aqueous solution.
Why doesn’t 1.00°Bx equal 1.00% coffee TDS? Because roasted coffee solubles are a complex mixture of aromatic rings (caffeine, trigonelline, chlorogenic acids, melanoidins), organic acids, and minerals whose average specific refractive increment (dn/dc) is roughly 17.6% higher than that of pure sucrose! In other words, 0.85 g of dissolved coffee solids bends light by the exact same angle as 1.00 g of dissolved sucrose.
Therefore, across both filter coffee (1.0%–1.8% TDS) and espresso (7.0%–12.0% TDS), the empirical conversion from a temperature-compensated Brix reading (°Bx at 20°C) to Coffee TDS% is:
Coffee TDS (%) = 0.8518 × Brix (°Bx) ≈ 0.85 × BrixReference Refractive Index (n_D^20), Brix, and Coffee TDS% Conversion Table
The table below provides exact optical calibrations at 20.0°C (589.3 nm) across the entire coffee brewing range:
| Brew Category | Refractive Index (n_D^20) |
Refractive Shift (Δ n_D vs. Water) |
Measured Brix (°Bx) |
Exact Coffee TDS% (0.8518 × Bx) |
Typical Extraction Yield (EY% at Standard Ratio) |
|---|---|---|---|---|---|
| Zero Calibration (Distilled Water) | 1.33299 |
0.00000 |
0.00°Bx |
0.00% TDS | 0.0% |
Light / High-Ratio Filter (1:18) |
1.33503 |
+0.00204 |
1.35°Bx |
1.15% TDS | 18.8% (Percolation) |
Balanced Pour-Over (1:16.5) |
1.33540 |
+0.00241 |
1.60°Bx |
1.36% TDS | 20.1% (Percolation) |
| Rich Immersion / Bypass Concentrate | 1.33583 |
+0.00284 |
1.88°Bx |
1.60% TDS | 21.3% (Immersion) |
Allongé / Turbo Lungo (1:3.5) |
1.34055 |
+0.00756 |
4.93°Bx |
4.20% TDS | 22.8% (Espresso) |
Modern Espresso (1:2.2) |
1.34965 |
+0.01666 |
10.57°Bx |
9.00% TDS | 20.5% (Espresso) |
Ristretto (1:1.5) |
1.35440 |
+0.02141 |
13.50°Bx |
11.50% TDS | 17.8% (Espresso) |
3. Why Temperature Drift Is the #1 Cause of Bad TDS Readings
Look closely at the refractive shift column (Δ n_D) in the table above: a 0.10% TDS change in filter coffee shifts the refractive index by only 0.000178!
Now compare that tiny solute signal against the thermal expansion of water: near 22°C–30°C, the refractive index of water changes with temperature at a rate of:
(dn_D) / (dT) ≈ -0.000105 per °CNotice the alarming implication: a mere 1.7°C temperature error between the liquid coffee sample and the refractometer’s internal thermistor creates a fake +0.10% TDS shift (± 1.5% extraction yield error)! Even though digital refractometers feature Automatic Temperature Compensation (ATC), the ATC thermistor is embedded underneath the metal or glass prism well. If you place a warm 45°C drop of coffee onto a 22°C prism and press “Read” immediately:
- The thin liquid film is still
8°Cwarmer than the buried thermistor, causing the instrument to under-read trueTDSby0.30%to0.50%. - Simultaneously, water evaporates rapidly from the warm open drop, concentrating the solute and causing the reading to climb continuously with every consecutive button press!
4. Five-Step Laboratory SOP for Sub-0.02% TDS Repeatability
To achieve laboratory-grade repeatability (± 0.01%–0.02% TDS) on every brew:
- Stir the Carafe or Espresso Cup Thoroughly Before Sampling: Percolated coffee stratifies strongly inside the server (the early, dense extract sits on the bottom while late, dilute drawdown water floats on top). Unstirred top-layer samples can under-report true carafe
TDSby0.25%! - Syringe-Filter All Non-Paper-Filtered Brews (
0.22 µmor0.45 µm): For espresso, French press, cupping, or metal-mesh brews, draw2 mLinto a syringe, attach a0.22 µmor0.45 µmhydrophilic PES/nylon syringe filter, discard the first3drops, and dispense the crystal-clear filtrate into a sample cup. Without filtration, suspended oil droplets and cellulose fines blur the critical-angle shadow line and inflateTDSby+0.3%to+1.1%. - Cool the Sample to Ambient Temperature (
20–23°C) Before Loading the Prism: Swirl1–2 mLof sample inside a thin metal spoon or sealed micro-vial for30 secondsuntil it reaches room temperature before placing a drop on the prism, preventing evaporative concentration inside the sample well. - Zero-Calibrate Before Each Session with Distilled Water: Never zero a refractometer with remineralized brew water or tap water; always zero with
0.00 ppmdistilled water at ambient room temperature. - Wait
20 SecondsUnder a Closed Cover Lid Before Pressing Read: Close the light cover immediately after applying0.3 mLof cooled sample and wait20 secondsso the liquid film and prism thermistor reach exact thermal equilibrium (Δ T < 0.1°C).
Practical check: what to observe
Take repeat readings with the same preparation method and record their spread. Clean the prism between samples. If values drift while a sample cools, resolve the measurement conditions before attributing a tiny change in extraction yield to your brewing technique.
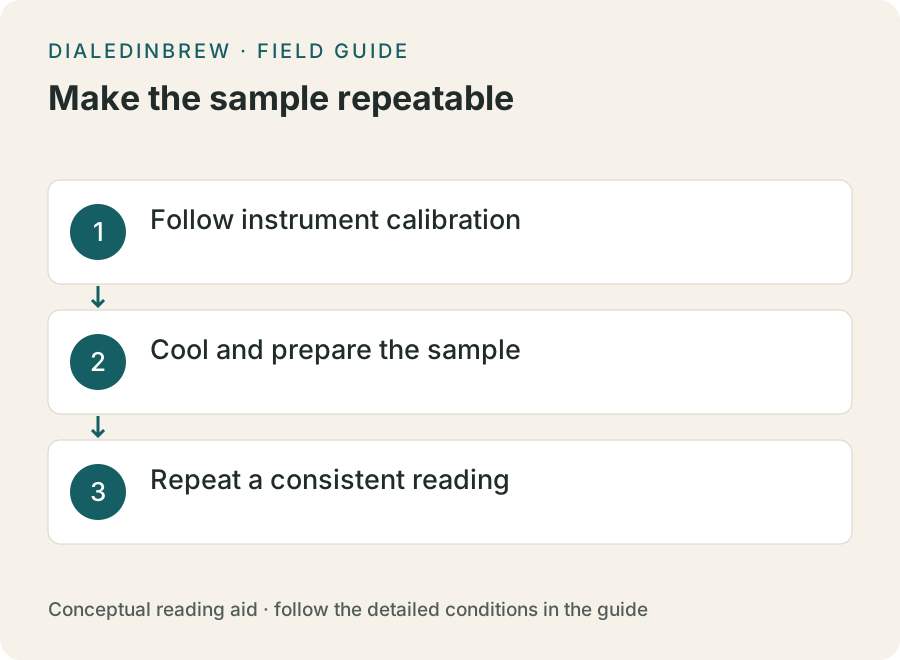
- Follow instrument calibration
- Cool and prepare the sample
- Repeat a consistent reading
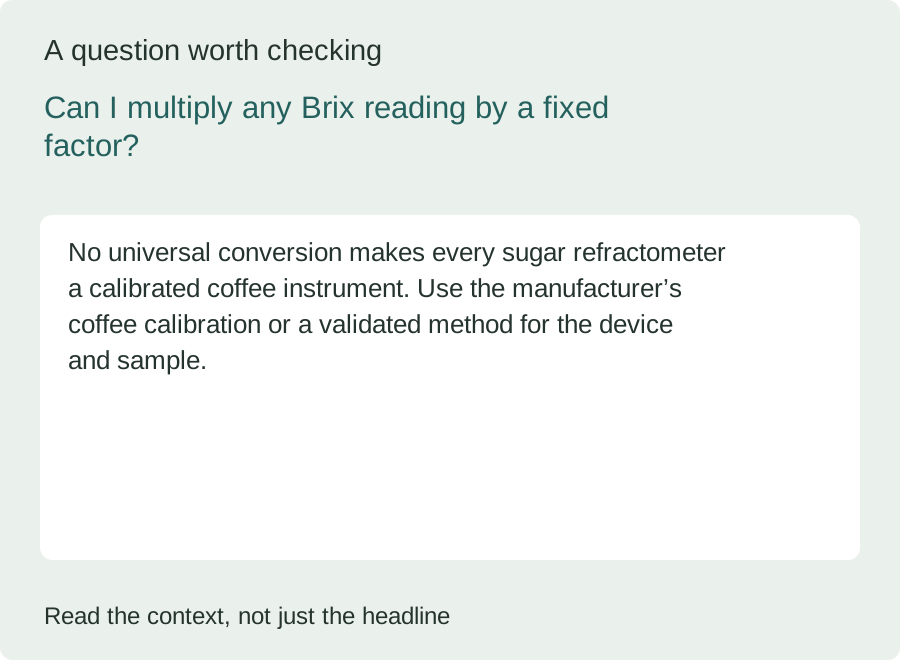
Can I multiply any Brix reading by a fixed factor?
No universal conversion makes every sugar refractometer a calibrated coffee instrument. Use the manufacturer’s coffee calibration or a validated method for the device and sample.
For more context, see the topic FAQ and glossary. A reference value or example should be read with its units, assumptions and product-specific conditions.
Sources and scope
The references below were supplied with the original manuscript. A reference is not evidence that every numerical claim has been independently checked. See the source library and our verification status.
- Fedele et al. – Optical Refractive Index vs. Gravimetric Oven-Drying Calibration for Aqueous Coffee Extracts (Journal of Food Measurement and Characterization)
- ICUMSA – International Commission for Uniform Methods of Sugar Analysis: Refractive Index Tables at 20°C and 589.3 nm
- AOAC Official Method 932.14 – Solids in Syrups and Beverage Extracts by Refractometer
Put the explanation to work
Continue reading
Spot a questionable claim or a calculation issue? Read our correction process and contact information. Examples and illustrations are educational; they do not establish product suitability or a laboratory result.