 Cup & Ratio
Extraction Physics & Yield Math
Coffee extraction yield and TDS explained
For a simple beverage-based calculation, 250 g of coffee at 1.20% TDS contains 3 g of dissolved coffee.
Before you start
For a simple beverage-based calculation, 250 g of coffee at 1.20% TDS contains 3 g of dissolved coffee. Dividing by a 15 g dry dose gives 20% beverage-based extraction yield. Writing out the units helps avoid confusing 1.20 with the decimal fraction 0.012.
Every quantitative conversation in specialty coffee relies on two distinct metrics: Total Dissolved Solids (TDS), which measures the mass concentration of soluble coffee matter in the finished liquid beverage, and Extraction Yield (EY), which measures the percentage of the original dry roasted coffee bean mass that dissolved into the brew. While most baristas treat the extraction yield equation as a single universal formula, applying the standard drip-percolation equation to a full-immersion brew introduces a systematic mathematical error of 2.2% to 3.4% EY.
Understanding why percolation and immersion require different mass-balance equations requires tracking where the brew water goes, how soluble solids distribute between the free slurry and the porous cellular matrix of the coffee grounds, and how the Liquid Retention Ratio (LRR) alters the concentration denominator. You can run both equations side-by-side in our Coffee Extraction Yield (EY%), TDS & Brew Ratio Compass.
1. Defining Total Dissolved Solids (TDS) and Beverage Mass
Total Dissolved Solids (TDS, expressed as a percentage by mass) represents the ratio of dissolved coffee solubles (M_solubles, in grams) to the total mass of the liquid coffee beverage (M_bev, in grams):
TDS (%) = (M_solubles) / (M_bev) × 100If a 250 g cup of filter coffee measures 1.38% TDS on a digital coffee refractometer after syringe-filtering and cooling to 20.0°C, the exact mass of dissolved coffee solids sitting inside that cup is:
M_solubles, cup = 250 g × (1.38) / (100) = 3.45 gThe remaining 246.55 g is water; TDS measures only beverage concentration, not dry dose.
2. The Percolation Mass-Balance Equation (Drip, Pour-Over & Espresso)
In a percolation system (such as a V60, Kalita Wave, batch brewer, or espresso machine), fresh solvent—clean hot brew water containing 0.00% TDS of coffee solubles—continuously enters the top of the coffee bed while concentrated coffee extract exits the bottom filter.
Because fresh water is poured onto the bed in stages (or forced through by a 9-bar pump), a concentration gradient forms vertically across the bed. During the final drawdown phase, the liquid trapped inside the spent coffee grounds at the top and middle of the cone is substantially more dilute than the early, high-concentration extract that already dripped into the carafe below. Furthermore, the liquid retained in the spent bed is discarded with the filter paper.
For percolation brews, the standard practical convention—established by Lockhart (1957) and adopted by the Specialty Coffee Association—evaluates the solubles recovered in the beverage plus a small correction, or more commonly in modern cafe refractometry, calculates Beverage Extraction Yield (EY_perc) directly from the mass of liquid collected in the vessel (M_bev) divided by the dry dose (D):
EY_perc% = (M_bev × TDS (%)) / (D)Worked Percolation Example (V60 Pour-Over)
Suppose you brew a washed Ethiopian heirloom coffee on a V60:
- Dry Dose (
D):15.0 g - Total Water Poured (
W):250.0 g(nominal water-to-coffee ratio of16.67 : 1) - Final Beverage Mass in Carafe (
M_bev):218.5 g - Refractometer Reading (
TDS):1.39%
Substituting these values into the percolation formula gives:
EY_perc% = (218.5 g × 1.39%) / (15.0 g) = (303.715) / (15.0) = 20.25%Because 3.04 g of coffee solids dissolved into the cup, the spent coffee bed and filter retained 34.5 g of water—a Liquid Retention Ratio (LRR) of 2.30 g/g.
3. Why Full-Immersion Brewing Requires a Different Formula
Now consider a full-immersion brew—such as a cupping bowl, French press, Clever Dripper (steeped before opening the valve), or standard inverted AeroPress. Here, the entire mass of brew water (W) and the entire dry dose (D) sit together in a single vessel for 3 to 5 minutes.
As soluble compounds diffuse out of the roasted cell walls and into the surrounding water, thermal convection and stirring homogenize the liquid. By the end of the steep, the liquid slurry is at a uniform concentration throughout the vessel: the water trapped inside the porous coffee particles and between the grounds has the exact same TDS as the liquid you pour into your cup.
When you plunge a French press and decant 212 g into a mug while leaving 38 g of coffee-saturated liquid in the spent grounds, plugging only M_bev = 212 g into the percolation formula ignores the dissolved coffee solids trapped in that 38 g of retained liquid.
Deriving the Exact Immersion Extraction Yield Formula
In a well-mixed immersion slurry containing W grams of added water and M_solubles, total grams of dissolved coffee solids, the total mass of the liquid phase (free liquid plus retained interstitial liquid) is W + M_solubles, total. Because the TDS measured in a sample drawn from the slurry equals the mass fraction of solubles across the entire liquid phase:
(TDS) / (100) = (M_solubles, total) / (W + M_solubles, total)Solving for M_solubles, total and dividing by the dry dose D yields the exact thermodynamic immersion equation:
EY_imm, exact% = (W × TDS (%)) / (D × (1 - (TDS (%)) / (100)))Because TDS in filter-strength immersion coffee is around 1.2% to 1.6%, the denominator factor (1 - TDS/100) is approximately 0.986. Consequently, many baristas use the linear immersion approximation:
EY_imm, approx% ≈ (W × TDS (%)) / (D)4. Comparing Percolation vs. Immersion Math Across Brew Methods
The table below demonstrates the quantitative discrepancy across five standard brewing formats when comparing percolation and immersion equations at a fixed 15.0 g or 18.0 g dose:
| Brew Method | Mechanics | Dry Dose (D) |
Water Added (W) |
Beverage Yield (M_bev) |
Retained Water (LRR) |
Measured TDS (%) |
Percolation EY% Formula |
Immersion EY% Formula |
Correct EY% to Report |
|---|---|---|---|---|---|---|---|---|---|
| V60 Pour-Over | Percolation | 15.0 g |
250.0 g |
218.0 g |
2.13 g/g |
1.38% |
20.06% | 23.00% |
20.06% (Percolation) |
| Espresso (1:2.2) | Pressurized Percolation | 18.0 g |
61.5 g |
40.0 g |
1.19 g/g |
9.20% |
20.44% | 31.43% |
20.44% (Percolation) |
| French Press | Full Immersion | 15.0 g |
250.0 g |
208.0 g |
2.80 g/g |
1.26% |
17.47% |
21.00% | 21.00% (Immersion) |
| SCA Cupping Bowl | Full Immersion | 12.0 g |
200.0 g |
0 g (spooned) |
N/A | 1.23% |
N/A | 20.50% | 20.50% (Immersion) |
| Clever Dripper | Steep-and-Release | 15.0 g |
250.0 g |
216.0 g |
2.27 g/g |
1.28% |
18.43% |
21.33% | 21.33% (Immersion) |
Why does the French press cup measure weaker (1.26% vs 1.38% TDS) despite a higher extraction yield (21.00% vs 20.06%) at the same 15 g : 250 g ratio? In percolation, fresh water flushes concentrated solubles into the carafe while leaving dilute water behind in the spent bed; in immersion, the 42 g of liquid retained in the grounds holds the exact same 1.26% TDS concentration as the decanted cup.
5. Why Percolation Is Diffusionally More Efficient Than Immersion
Fick’s First Law of Diffusion states that diffusive flux J out of a coffee particle scales with the concentration gradient (C_particle - C_bulk) across boundary layer δ. In full immersion, bulk liquid concentration rises toward 1.2%–1.4% TDS within 90 seconds, shrinking the gradient and self-limiting extraction. In percolation, fresh 0.00% TDS water continuously resets C_bulk near zero, sustaining high extraction efficiency while making bypass channels prone to pulling dry polyphenols (see Sensory Triangulation: Sour-Bitter Confusion vs. Astringency).
6. Practical Workflow for Baristas and Roasters
When logging recipes and calibrating grinders across brewing methods:
- Always weigh the final beverage mass (
M_bev) on a0.1 gscale for percolation brews (V60, Kalita, Origami, Chemex, batch brewer, and espresso) after removing the dripper. Never estimateM_bevby subtracting2 × Dfrom poured water, becauseLRRshifts with roast level, grind size, and filter geometry. - Always use total poured water mass (
W) when computing extraction yield for full-immersion brews (cupping, French press, Clever Dripper, Hario Switch in closed-valve mode, and standard AeroPress). - Filter all syringe samples through a
0.22 µmor0.45 µmmembrane before placing drops on the refractometer prism on metal-filtered brews (espresso, French press, cupping) so suspended lipid droplets and insoluble cellulose fines do not scatter the LED beam and artificially inflate the refractive index reading (see Refractometer Brix-to-TDS Conversion & Temperature Errors).
Practical check: what to observe
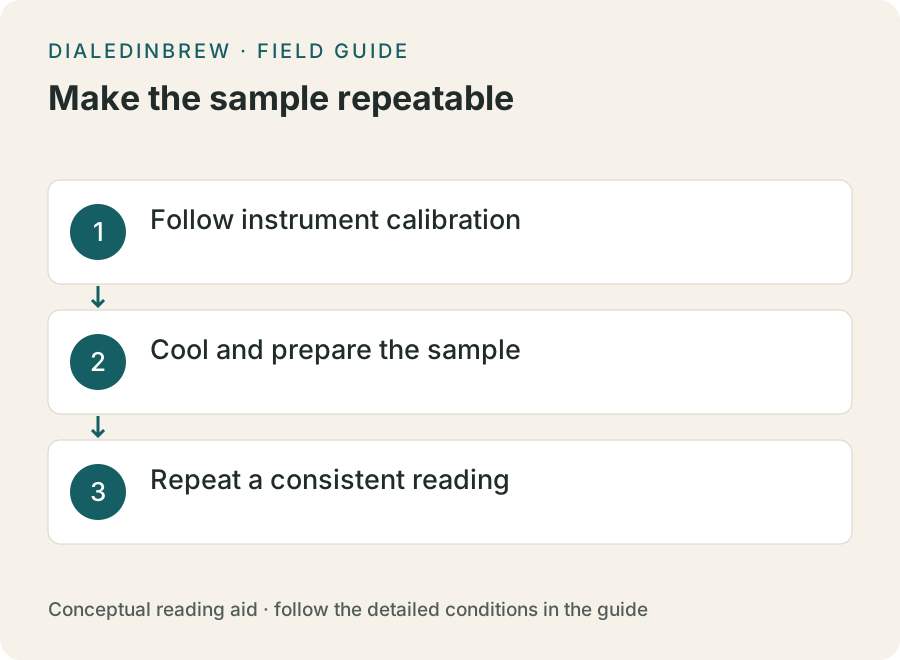
Record which calculator mode you used and keep it the same when comparing recipes. Small changes in sample preparation or the scale reading can move the result. Treat the displayed decimal places as arithmetic precision, not a promise of measurement accuracy.
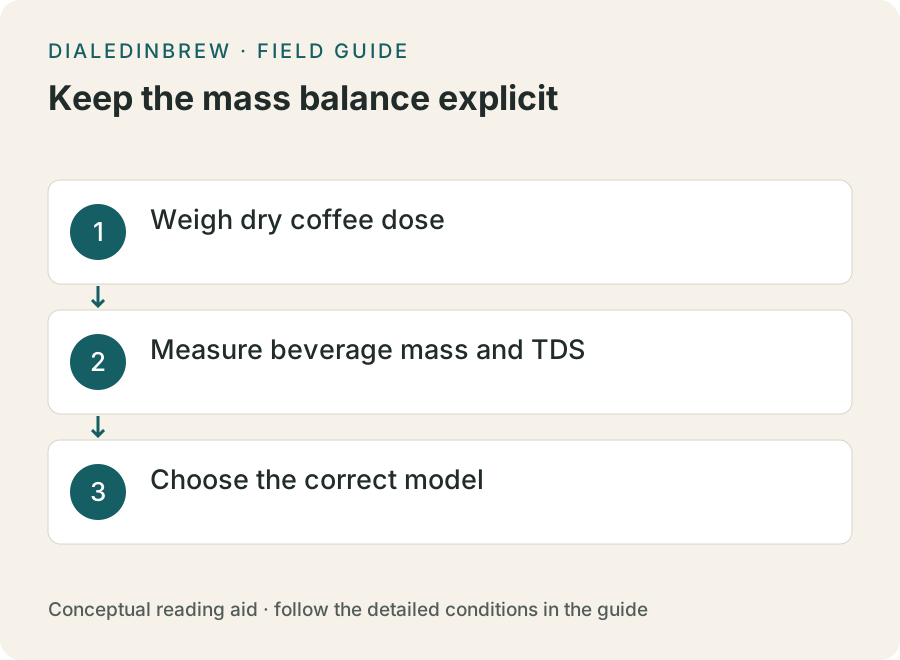
- Weigh dry coffee dose
- Measure beverage mass and TDS
- Choose the correct model
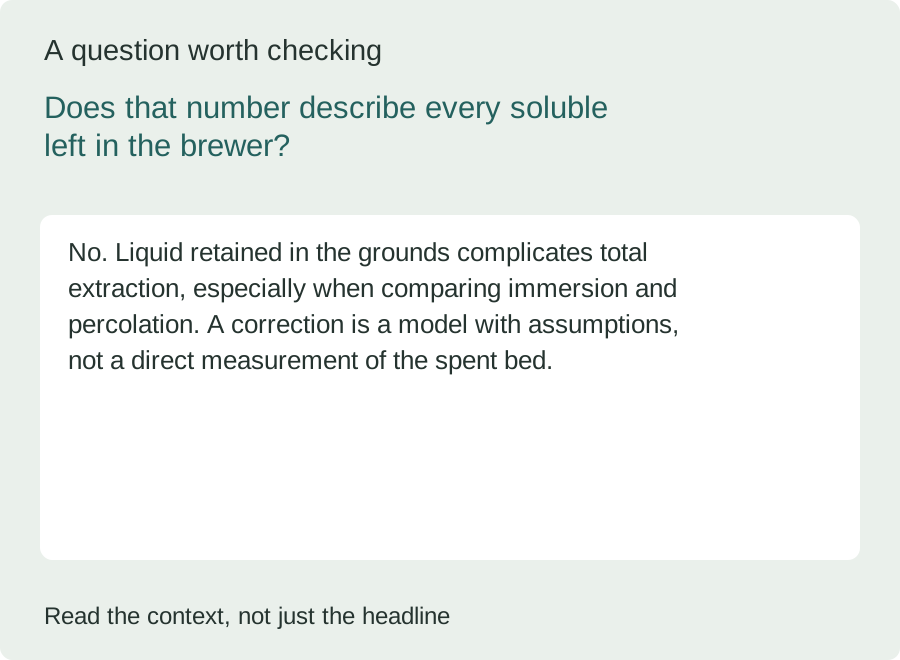
Does that number describe every soluble left in the brewer?
No. Liquid retained in the grounds complicates total extraction, especially when comparing immersion and percolation. A correction is a model with assumptions, not a direct measurement of the spent bed.
For more context, see the topic FAQ and glossary. A reference value or example should be read with its units, assumptions and product-specific conditions.
Sources and scope
The references below were supplied with the original manuscript. A reference is not evidence that every numerical claim has been independently checked. See the source library and our verification status.
- Lockhart – The Soluble Solids in Beverage Coffee as an Index to Cup Quality (Coffee Brewing Institute)
- Moroney et al. – Modelling of coffee extraction during brewing using multiscale methods (Chemical Engineering Science)
- Frost, Ristenpart & Guinard – Effect of basket geometry on the sensory quality and consumer acceptance of drip brewed coffee (Journal of Food Science)
Put the explanation to work
Continue reading
Spot a questionable claim or a calculation issue? Read our correction process and contact information. Examples and illustrations are educational; they do not establish product suitability or a laboratory result.