 Cup & Ratio
Roast Chemistry, Thermal & Filter Mechanics
Coffee degassing, resting and bloom behavior
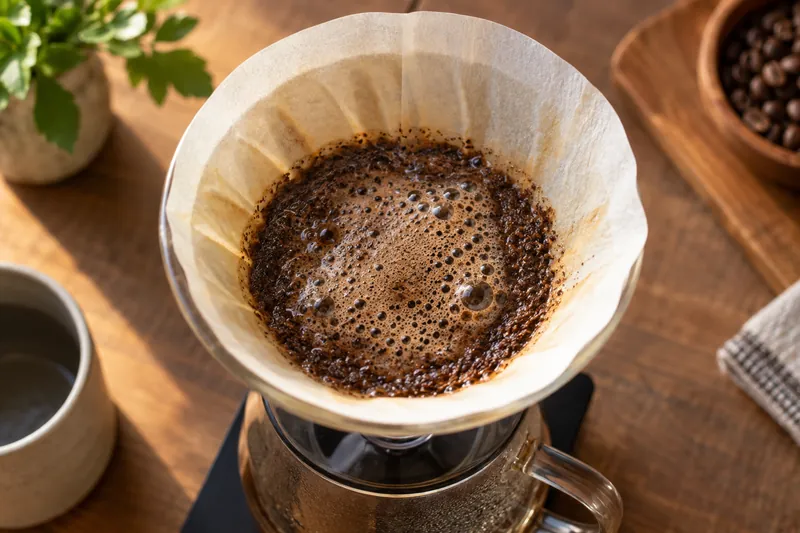
A vigorous bloom shows gas release, but it is not a freshness score that works across every roast and processing method.
Before you start
A vigorous bloom shows gas release, but it is not a freshness score that works across every roast and processing method. Packaging, roast level and storage influence the observation. Keep the same coffee sealed between comparisons and record when the bag was opened.
Anyone who has poured 94°C water onto coffee roasted 24 hours earlier has witnessed the dramatic coffee bloom: the slurry swells into a frothy, bubbling dome that hisses and releases fragrant aromas—yet the resulting cup often tastes paradoxically sour, thin, astringent, and carbonic-metallic. Conversely, waiting 10 to 14 days allows that exact same light-roast coffee to brew with syrupy sweetness, stable espresso flow, and +1.5% higher extraction yield.
To manage coffee rest windows and bloom mechanics scientifically, we need to understand how carbon dioxide (CO₂) is synthesized during roasting, how it stays pressurized inside the cellulose pore structure, and how outgoing CO₂ flux physically opposes incoming liquid water during the first 45 seconds of brewing.
1. Where Roast CO₂ Comes From and How Much Is Trapped
During the Maillard reaction, Strecker degradation (150–190°C), and pyrolysis/caramelization stages (190–225°C) of coffee roasting, amino acids and reducing sugars undergo decarboxylation reactions that generate massive volumes of gas—roughly 87% CO₂, 7% carbon monoxide (CO), and 6% nitrogen and volatile organic compounds (VOCs).
Because the cellulose cell walls of the bean soften into a glassy-rubbery state at roasting temperatures and then rapidly vitrify (harden back into a rigid glassy matrix) on the cooling tray, a large fraction of the generated CO₂ remains trapped under internal pressures of 6 to 15 bar inside microscopic micropores (< 2 nm) and macropores (20–50 µm):
- Light Filter Roast (Agtron
70–80): Retains4.5 to 6.5 mg CO₂ per gramof roasted coffee immediately out of the cooler (\sim 2.5–3.5 L of gas per kg). - Medium-Dark Espresso Roast (Agtron
45–55): Generates8.5 to 12.0 mg CO₂ per gramof roasted coffee (\sim 4.5–6.0 L of gas per kg), though its cell walls are much more porous and fractured.
2. Fickian Diffusion: Why Light Roasts Rest Slower Than Dark Roasts
Wait—if dark roasts contain nearly twice as much initial CO₂ right out of the roaster as light roasts, why do dark roasts finish degassing in 3–5 days while ultra-light Nordic roasts often require 14–21 days before peaking?
Whole-bean degassing is governed by Fick’s Second Law of Diffusion through a porous spherical matrix of effective diffusivity D_eff:
(∂ C) / (∂ t) = D_eff ((∂^2 C) / (∂ r^2) + (2) / (r)(∂ C) / (∂ r))In a dark roast taken into or past second crack (> 218°C), thermal cellulose degradation and high internal steam/CO₂ pressure blow open micro-fissures across the cell walls. Its effective gas diffusivity D_eff is 3 to 5 times higher than that of a dense, high-elevation light roast dropped early after first crack (198–204°C). In the light roast, the cellulose walls remain thick, intact, and glassy, trapping CO₂ in isolated micropores where gas molecules can only escape via slow solid-state diffusion.
3. Why Outgassing CO₂ Disrupts Extraction During Brewing
When 93°C water contacts coffee grounds during a pour-over or espresso shot, three physical mechanisms trigger an explosive release of the remaining trapped CO₂:
- Ideal Gas Thermal Expansion (
PV = nRT): Heating trapped gas from20°C(293 K) to93°C(366 K) immediately increases internal gas pressure by25%while simultaneously softening the glassy biopolymer matrix. - Competitive Capillary Displacement: Liquid water displays higher affinity for the hydrophilic cellulose cell walls than non-polar
CO₂, displacing adsorbed gas molecules from internal pore surfaces. - Counter-Current Gas Flux Barrier: As
CO₂bubbles nucleate and expand out of the20–50 µmpore throats, the outward velocity of escaping gas physically blocks liquid brew water from wetting the interior of the coffee particle!
Worse yet, in a percolation bed (V60 or espresso puck), escaping gas bubbles coalesce in the interstitial voids between particles (airlocks), buoyantly lifting lighter coffee particles to the top of the slurry while forcing brew water to channel around the gas pockets. Finally, the fraction of CO₂ that dissolves into high-pressure espresso water forms carbonic acid (H₂CO₃), adding a harsh, prickly, metallic sourness that masks natural citric and malic fruit sweetness.
4. Degassing Timeline & Optimal Rest Windows by Roast and Brew Method
The table below tracks residual whole-bean CO₂ content, post-grind degassing loss, and recommended rest windows (stored in one-way valve bags at 20°C) across four roast profiles:
| Roast Profile & Bean Density | Initial CO₂ (Day 0) |
Residual CO₂ at Day 5 |
Residual CO₂ at Day 14 |
Optimal Pour-Over Rest Window | Optimal Espresso Rest Window | Recommended Pour-Over Bloom Protocol |
|---|---|---|---|---|---|---|
Ultra-Light Nordic (Agtron 80+, High Altitude) |
4.8 mg/g |
3.6 mg/g |
2.1 mg/g |
Day 10 to Day 28 | Day 14 to Day 35 | 3.0 × Dose water, 45–60 s bloom with gentle swirl |
Light-Medium Specialty (Agtron 65–75) |
6.2 mg/g |
3.9 mg/g |
1.8 mg/g |
Day 5 to Day 21 | Day 9 to Day 24 | 3.0 × Dose water, 35–45 s bloom |
Medium Classic Espresso (Agtron 52–62) |
8.5 mg/g |
3.4 mg/g |
1.3 mg/g |
Day 4 to Day 14 | Day 6 to Day 18 | 2.5 × Dose water, 30–35 s bloom |
Medium-Dark / Dark (Agtron 40–50, Porous) |
10.8 mg/g |
2.5 mg/g |
0.8 mg/g |
Day 2 to Day 9 | Day 3 to Day 11 | 2.5 × Dose water, 25–30 s bloom at 86–89°C |
5. How to Brew Coffee That Is “Too Fresh” (Emergency Degassing Protocol)
What if you have to brew or dial in a coffee roasted only 24–72 hours ago? Because diffusion time scales with the square of the diffusion path length (t ∝ r^2), reducing the particle radius r from a 4,000 µm whole bean to a 300–600 µm ground particle accelerates degassing by a factor of 100 to 200:
- Pre-Grind Rest (
10–15 MinutesBefore Brewing): Grind your dose into a wide, shallow dosing tray 10 to 15 minutes before brewing. Over50%of the excess trappedCO₂vents harmlessly into the air while volatile aroma loss over a 12-minute dry wait is minimal compared to the massive gain in wetting uniformity. - Extend the Pour-Over Bloom to
60–90 Seconds: Pour3.0 to 3.5 gof hot water per gram of dry dose (45–52 gof water for a15 gdose), excavate dry pockets with a spoon or WDT tool so every particle is wetted within10 seconds, and wait a full60–90 secondsbefore starting your main extraction pours. You can verify the resulting extraction gain in our Coffee Extraction Yield (EY%), TDS & Brew Ratio Compass. - Use a
10–15 SecondLow-Pressure Espresso Pre-Infusion: In espresso, soaking the puck at1.5–2.0 barfor12 secondsventsCO₂out of the top and bottom of the basket before ramping to6–8 bar, preventing gas-pocket channeling (see Darcy’s Law in Espresso Pucks).
Practical check: what to observe
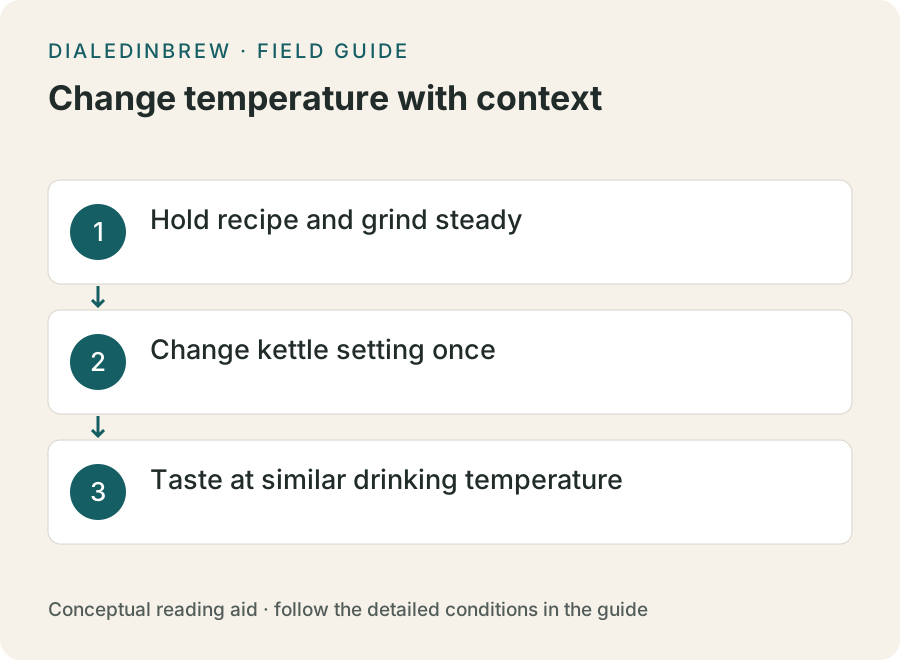
Log aroma, brew behavior and taste at similar serving temperatures. Change the bloom routine only after establishing a consistent baseline. A quieter bloom later in the bag does not by itself show that the coffee has become stale or unusable.
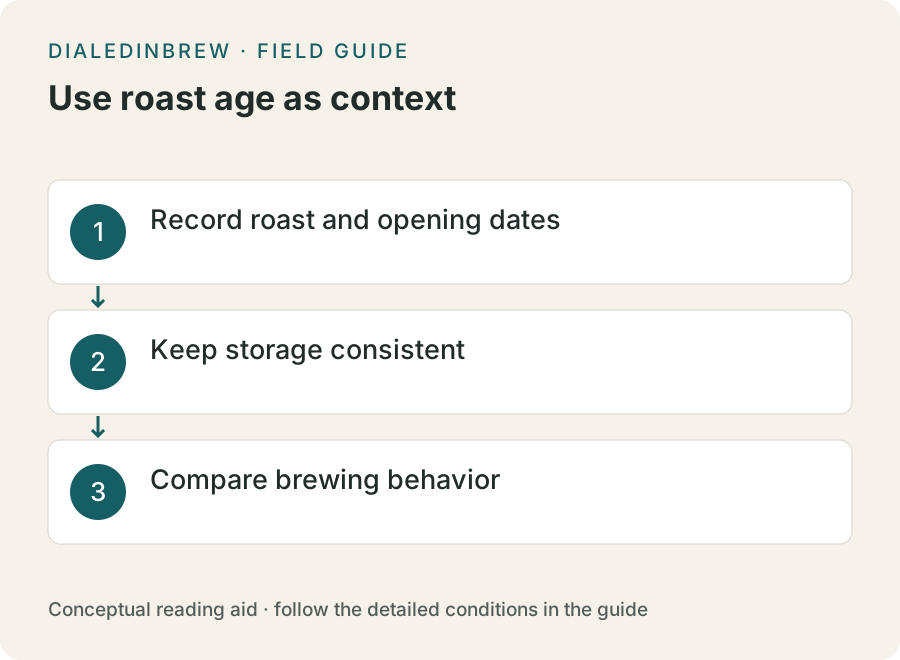
- Record roast and opening dates
- Keep storage consistent
- Compare brewing behavior
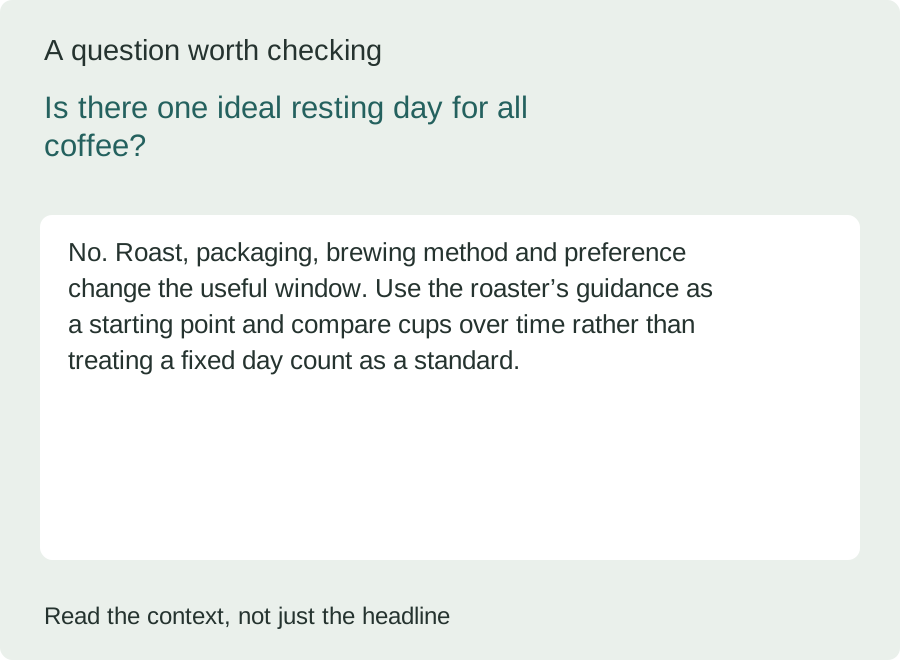
Is there one ideal resting day for all coffee?
No. Roast, packaging, brewing method and preference change the useful window. Use the roaster’s guidance as a starting point and compare cups over time rather than treating a fixed day count as a standard.
For more context, see the topic FAQ and glossary. A reference value or example should be read with its units, assumptions and product-specific conditions.
Sources and scope
The references below were supplied with the original manuscript. A reference is not evidence that every numerical claim has been independently checked. See the source library and our verification status.
- Smrke et al. – Time-Resolved Gravimetric and Mass Spectrometric Degassing Kinetics of Roasted Coffee (Journal of Agricultural and Food Chemistry)
- Wang & Lim – Effect of roasting conditions on carbon dioxide degassing behavior in coffee (Food Research International)
- Geiger et al. – Carbon Dioxide Release from Roasted Coffee: Pore Structure and Diffusion Mechanics (Journal of Food Science)
Put the explanation to work
Continue reading
Spot a questionable claim or a calculation issue? Read our correction process and contact information. Examples and illustrations are educational; they do not establish product suitability or a laboratory result.